So I finally got a Umik-1 (Actually for a DIY speaker project) but for the heck of it I took two initial sweeps of my listening room with the 0deg calibration file loaded - 0-20Khz, mic in head position one reading pointing at the RHS speaker and the second at the LHS speaker with only that respective speaker active for that reading.
I am still doing a ton of reading and learning here..... as a newbie with this software, where to next, just leave it and enjoy because it sounds just fine to me or should I take more readings and/or look at different graphs in REW?
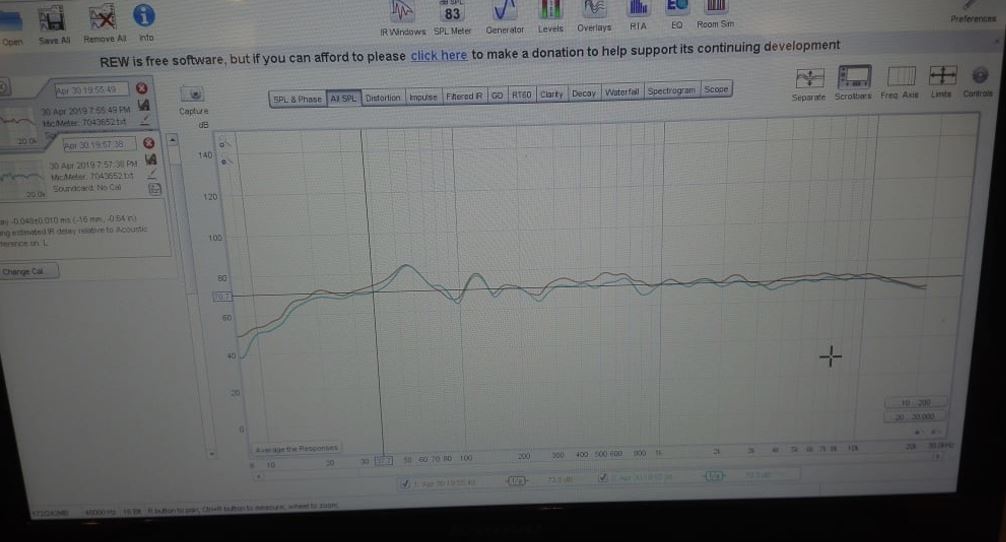
I am curious as to what the interpretation of the graph below - left and right speaker might show as abnormal if anything, I see a very slight bass bump, but a flattish line from 20hz the speakers are B&W N802, and the room is wall to wall treated with sound absorbing panels.
I am still doing a ton of reading and learning here..... as a newbie with this software, where to next, just leave it and enjoy because it sounds just fine to me or should I take more readings and/or look at different graphs in REW?
I am curious as to what the interpretation of the graph below - left and right speaker might show as abnormal if anything, I see a very slight bass bump, but a flattish line from 20hz the speakers are B&W N802, and the room is wall to wall treated with sound absorbing panels.